QCherga Analytics delivers real-time and predictive insights that help you optimize operations, elevate customer experience, and accelerate growth – no matter your industry or location
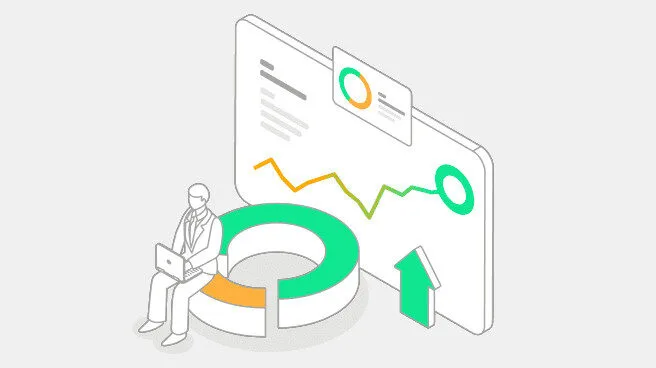
QCherga’s advanced analytics transform every customer interaction into actionable insights. With real-time data and on-demand reports, you can optimize queue management, improve service efficiency, and enhance the customer experience.
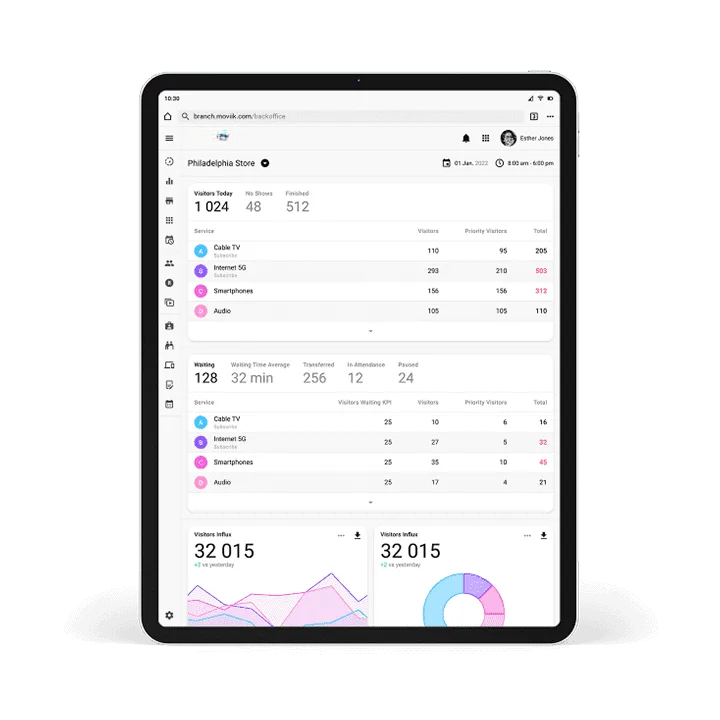
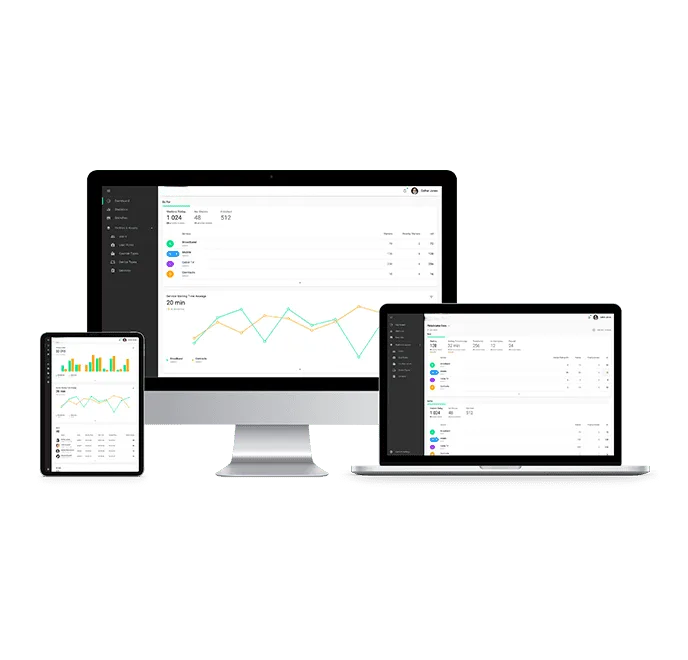
Gain a clear understanding of visitor flow, wait times, and staff performance - all from a web-accessible dashboard.
Create and customize Dashboards and Reports from scratch
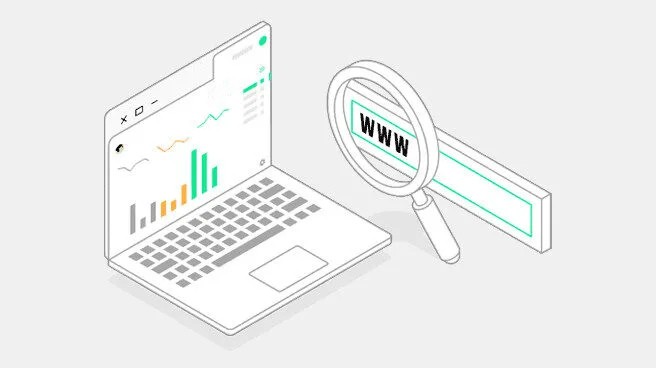
With QCherga Analytics, you can build your own dashboards and reports tailored to your business - no coding, no IT help required. Choose the data you want to see, apply filters like location or time range, and generate visuals that make sense for your operations.
Whether it's daily performance or long-term trends, everything is easy to configure and instantly actionable.
Key benefits of QCherga Analytics
Data-driven insights to optimize operations, enhance customer experiences, and improve decision-making.
Data-Driven Decisions
Make informed choices based on real-time and historical analytics.
Real-Time Insights
Monitor key data points instantly and adapt your strategies.
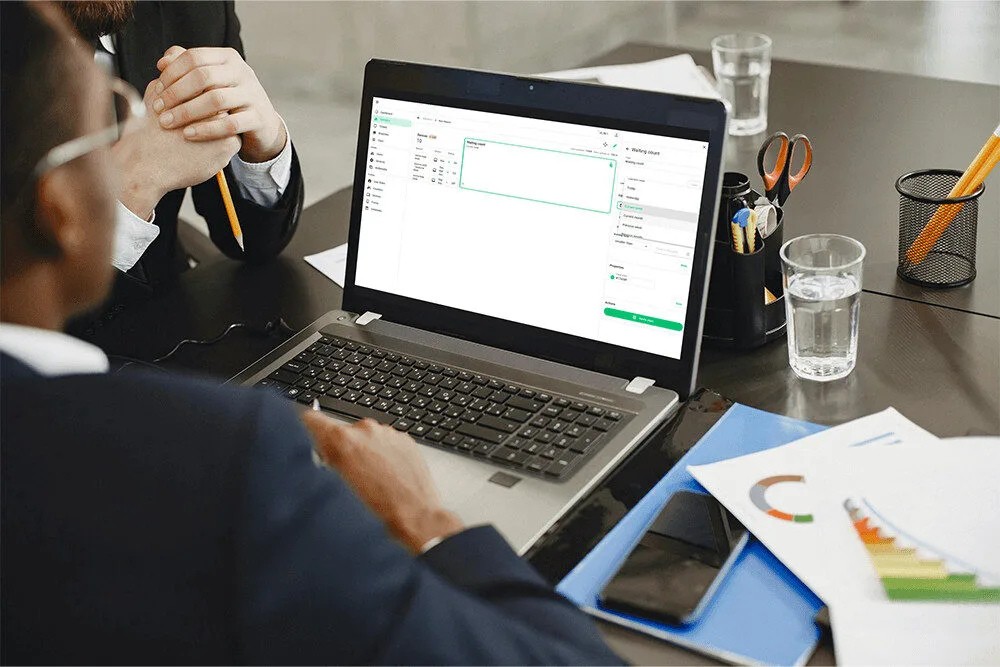
Web-Based Access
Access your analytics remotely and optimize service efficiency.
Comprehensive Reporting
Analyze visitor flow, wait times and agent performance.
Performance Tracking
Analyze visitor flow, wait and service times, and performance.
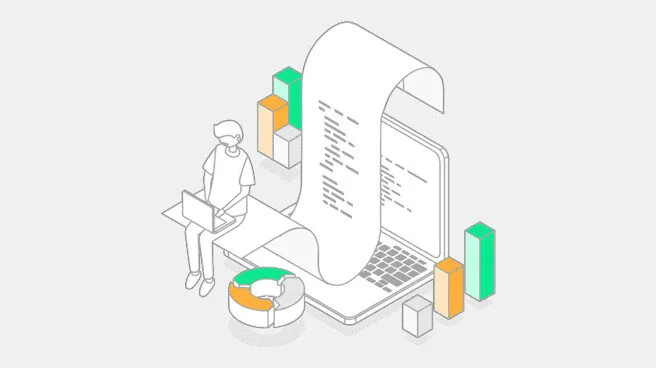
Downloadable Reports
Extract detailed reports on branches, service performance, and operations.
Heat Mapping
Identify peak hours with heatmaps and optimize staff allocation.
Actionable Metrics
Monitor KPIs like wait times, service durations, and customer flow.
Measurable results that matter
QCherga Analytics customers typically see significant improvements across key performance indicators:
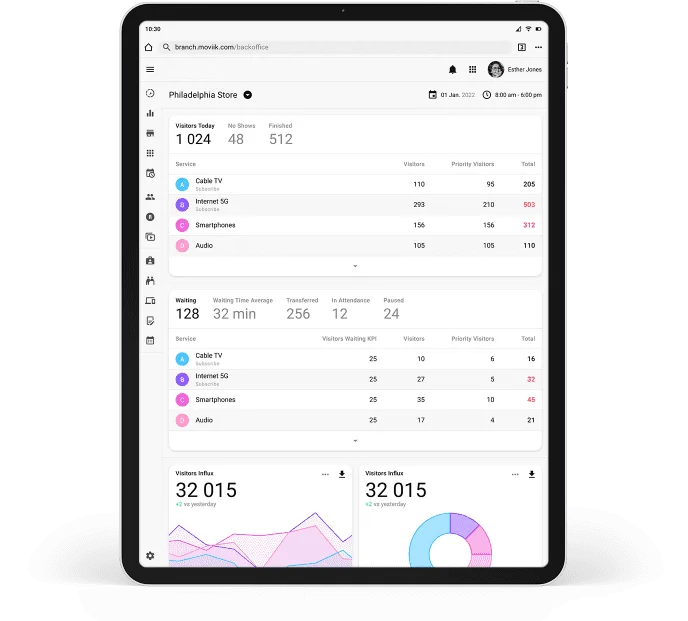
Track how many tickets are issued, served, canceled, and still waiting - essential KPIs to monitor service performance.
Visitor Flow
Visualize how visitors move through your space with real-time and historical heatmaps that reveal traffic and peak times.
Time Insights
Understand how long visitors wait and how long they’re served, crucial for improving speed and reducing bottlenecks.
Service Distribution
Compare regular and priority services to see where demand is highest and how resources are allocated.
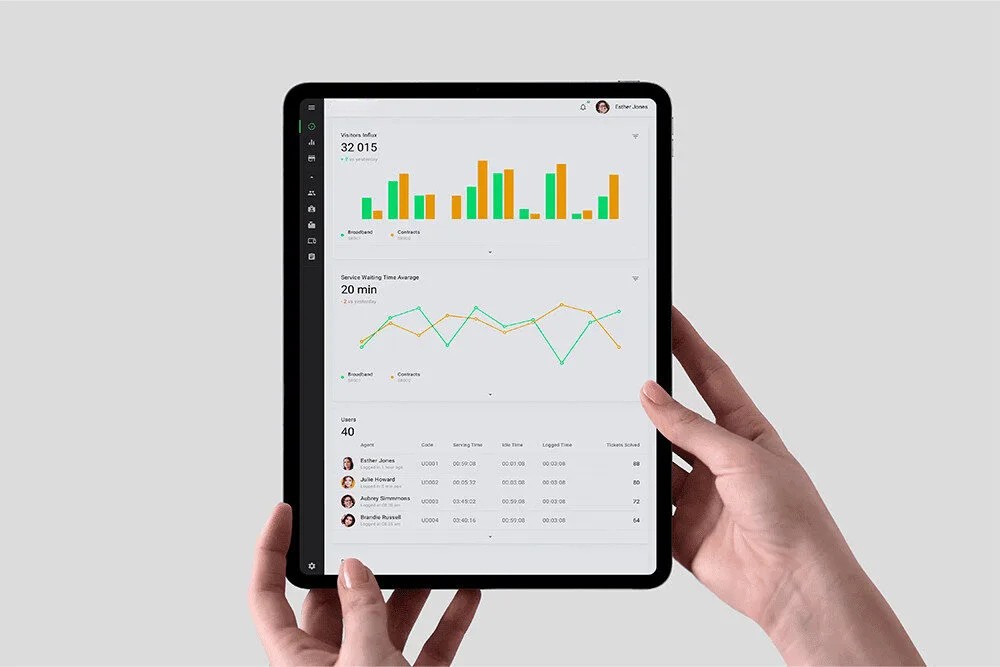
Staff Activity
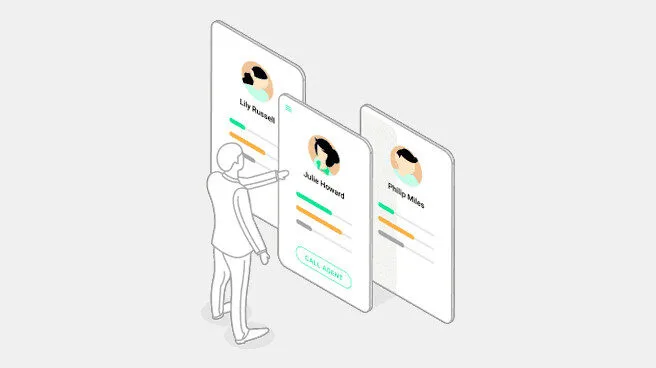
Monitor agent performance across branches or globally, including actions taken and time spent per customer.
Branch Performance
See how each location is performing based on visitor volume, service times, and overall throughput.
Service Desk Analysis
Drill into ticket patterns, queue types, and flow disruptions to fine-tune desk setup and team efficiency.
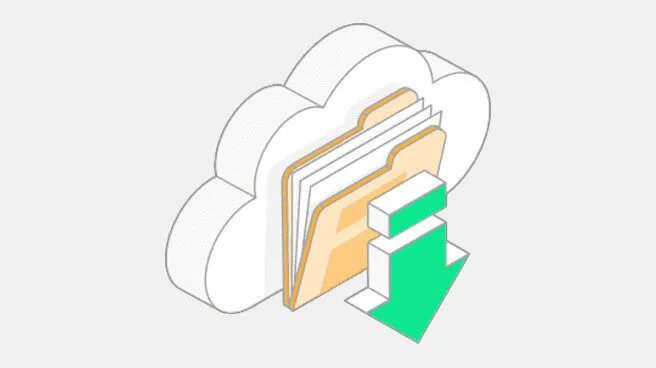
Access and export your data anywhere
Access insights anytime, from anywhere – no VPNs or local servers required.
Export to CSV and Excel
Easily download and analyze data in your preferred tools.
Google BigQuery Integration
Enable machine learning and deeper BI analysis by syncing your data to BigQuery.
Centralized data and insights across all your locations
Effortlessly manage every aspect of your operations with QCherga’s Backoffice. From branches to devices, our web-based platform puts everything at your fingertips. Key capabilities include:
AWS-Powered
Infrastructure
Enjoy reliability, security, and scalability - wherever you operate.
Flexible
Integrations
Connect via REST API to fit your existing workflows.
User-Friendly
Interface
Get up and running fast - no steep learning curve or IT headaches.
Ready for
Tomorrow
QCherga evolves with you, supporting advanced analytics.